Caltrans Smart Mobility Calculator
A Transportation, Housing, Climate Action Coordination Tool
  • Project Description
  • Directions
  • About Us
  • Links
  • Feedback
Smart Mobility Framework Placetypes Legend
SMF How-To Guide Induced VMT Calculator Urban Centers Urban Places*
Compact Suburban Places Suburban** Rural Places Employment Centers Special Districts
*Includes SMF "Close-In Compact Communities" **Includes SMF "Compact Communities"
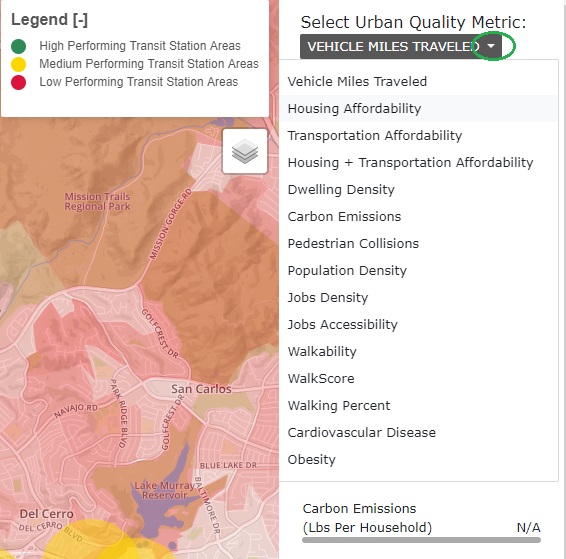
Selected Urban Quality Metric
  • Daily Vehicle Miles Traveled per Capita
  • Daily Home Base Work Vehicle Miles Traveled per Capita
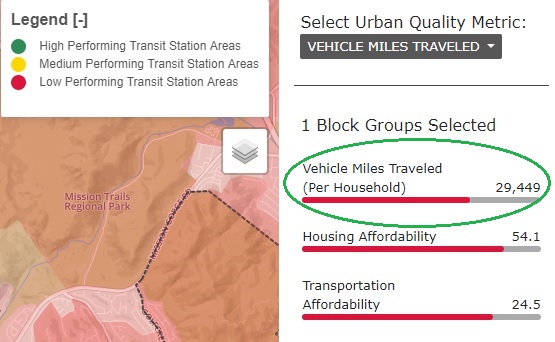
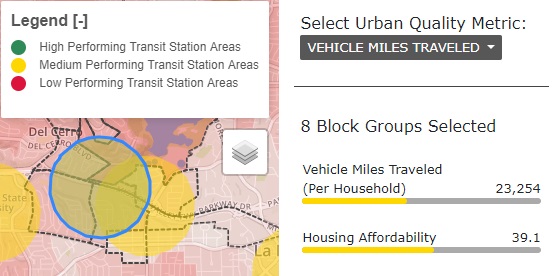
  • Annual Vehicle Miles Traveled per Household
  • Annual Carbon Emissions per Household
  • Housing Affordability
  • Transportation Affordability
  • Daily Carbon Emissions by Person
  • Daily Carbon Emissions by Employee
  • Pedestrian Collisions
  • Cardiovascular Disease
  • Obesity
  • Population Density
  • Jobs Density
  • Dwelling Density
  • Jobs Accessible From Transit
  • Jobs Accessible From Car
  • Walkability
  • WalkScore
  • Walking Percent
PERFORMANCE LEGEND
GOOD
MEDIUM
POOR
DISADVANTAGED COMMUNITIES OF CONCERN
Selected Block Groups (0)

  • Sustainability, Livability, Equity Performance
  • Lower Values are Better
  • VMT Per Capita (Daily) Caltrans 2017-
    Official State Data
    N/A
  • Home Base Work VMT Per Capita (Daily) Caltrans 2017-
    Official State Data
    N/A
  • VMT per Household (Annual) N/A
  • Carbon emissions per Household (Annual) N/A
  • Housing Affordability N/A
  • Transportation Affordability N/A
  • Daily Carbon Emissions
    (lbs per person)
    N/A
  • Daily Carbon Emissions
    (lbs per employee)
    N/A
  • Pedestrian Collisions
    (per 100k walkers)
    N/A
  • Obesity
    (Percentage Obese)
    n/a
  • Cardiovascular Disease
    (Percentile)
    n/a

  • Urban Form/Livability Opportunities
  • Higher Values are Better
  • Population Density
    (persons per acre)
    N/A
  • Jobs Density
    (jobs per acre)
    N/A
  • Dwelling Density
    (units per acre)
    N/A
  • Jobs Accessibility (Transit) N/A
  • Jobs Accessibility (Auto) N/A
  • Walkability
    (Intersection Density)
    n/a
  • walkscore n/a
  • Walking Percent n/a

Links

Press

  • City Is Poised to Back Down on Plan to Increase Height Limit - Again
  • KPBS Interview

Related Tools

  • ReStreet is an interactive tool for street design.
  • Transit Corridor Livability Calculator Download

Select a State:

Project Description

Developed by Dr. Bruce Appleyard (bappleyard@mail.sdsu.edu) and assistants Chris Allen and Eduardo Cordova, this new online Smart Growth Equity Calculator prototype is designed to help practitioners and researchers meet a variety of planning and design challenges related to corridors, station areas, and complete streets, climate action planning and providing affordable housing near transit in support of active and sustainable travel. This Smart Growth Equity Calculator builds on work developing The Handbook for Building Livable Transit Corridors and the associated Livability Calculator, sponsored by the National Academies of Sciences' Transportation Research Board.

In the future, this calculator will be designed to help plan the future of autonomous vehicles, as outlines in this publication on a new transportation/land use performance measurement framework. for now, this prototype covers San Diego, CA and San Mateo, CA, but we have the necessary data for California and the entire us.

Special thanks to Geoff Boeing, PhD, for his advice and assistance on this calculator.

See funding information here.

Data Sources

The following data sources were used in this project:

  • The EPA Smart Location Mapping Dataset
  • The HUD Location Affordability Index

About Us

Bruce Appleyard, PhD
bappleyard@mail.sdsu.edu

Dr. Appleyard is an Associate Professor in City & Regional Planning and Public Administration at SDSU, with doctoral training in geo-spatial analysis, behavioral economics, econometrics, and applied transportation and land use policy analysis. Dr. Appleyard is also an Associate Director in the Human Dynamics in the Mobile Age (HDMA) research center, and the Assistant Director of the Active Transportation Research Center, both based at SDSU. Dr. Appleyard has led several research efforts examining the relationship between public transport, land use, socio-economics, and a variety of outcomes related to public health, sustainability, economic vitality, and equity.

Dr. Appleyard was the co-PI for the development of the Handbook for Building Livable Transit Corridors and the associated Livability Calculator, sponsored by the National Academies of Sciences’ Transit Cooperative Research Project (TCRP). This required extensive geo-spatial and econometric, mixed method analysis of all transit stations and corridors throughout the us. Dr. Appleyard has also been the project lead for the development of the sustainable transportation calculator for the Smart Mobility Framework implementation project for the state of California.

Chris Allen

Chris Allen is a PhD candidate in the Department of Geography at SDSU, where he focuses on using geospatial techniques and new data sources to examine well-being in urban areas. prior to entering the PhD program, Chris worked as a software engineer in the avionics industry and completed an MA in urban history at San Diego State. As a research assistant at San Diego State, he has worked primarily on projects to collect and analyze social media data to study topics ranging from disease outbreak to disaster management. In this role, Chris’s duties have included database administration, web dashboard creation (both server-side and client-side programming), and geospatial analysis.

Eduardo Cordova

Eduardo Cordova graduated with distinction in his major from San Diego State University with a degree in geography with an emphasis in geographic information systems (GIS) in December of 2016. He has worked on a variety of projects which include the excel Livability Calculator, typology of transit corridor livability, carbon emissions study, and crime stop studies. his contributions range from map creation, python application development, and data interpretation and management. His primary skill-set include Python programming, ArcGIS, and Arc online.

Joseph Tinglof

Joseph Tinglof, a computer science student from San Diego State University, has provided ongoing techical assistance in further developing and maintaining the smart calculator.

Directions

Welcome to the beta version of our Smart Calculator! This Calculator is designed to help people, public agencies, and professionals make better decisions about growth and development (where and what kind) by allowing them to explore and understand urban quality throughout a community and a region, and how this urban quality relates to sustainability, livability, and social equity. We have detailed instructions below, but for a quick overview of the calculator's capabilities, see the following videos:

Viewing Urban Quality Metrics

When you open the Calculator, the first layer that comes up shows Vehicle Miles Traveled per household, which is an important metric for climate action planning, as well as evaluating environmental impacts of development projects. The lighter areas in this VMT layer shows low VMT per household, whereas the darker red areas indicate of higher VMT. Using mouse, exploring the region and these urban quality metrics is made easy through the dynamic hover select capability of your mouse. As you move through the region, these indicators will change based on your selections:

In addition to VMT, we have included a number of other urban quality metrics related to environmental impacts, afforadability, health, and social equity. These other layers can be viewed by selected the "Select Urban Quality Metric" dropdown on the right-hand side:
The circles show half mile catchment areas around transit stations using the high (green), medium (yellow), low (red) smart growth performance typology, based on our national study of urban quality of the National Academies of Sciences.

Selecting Layers

The Smart Calculator allows users to turn overlays on and off by using the layer selection control, which is located in the top-right corner of the map:

Hovering over the layer selection control will display the layers that are loaded into the calculator. show or hide layers by selecting or deselecting the checkboxes next to each layer label: